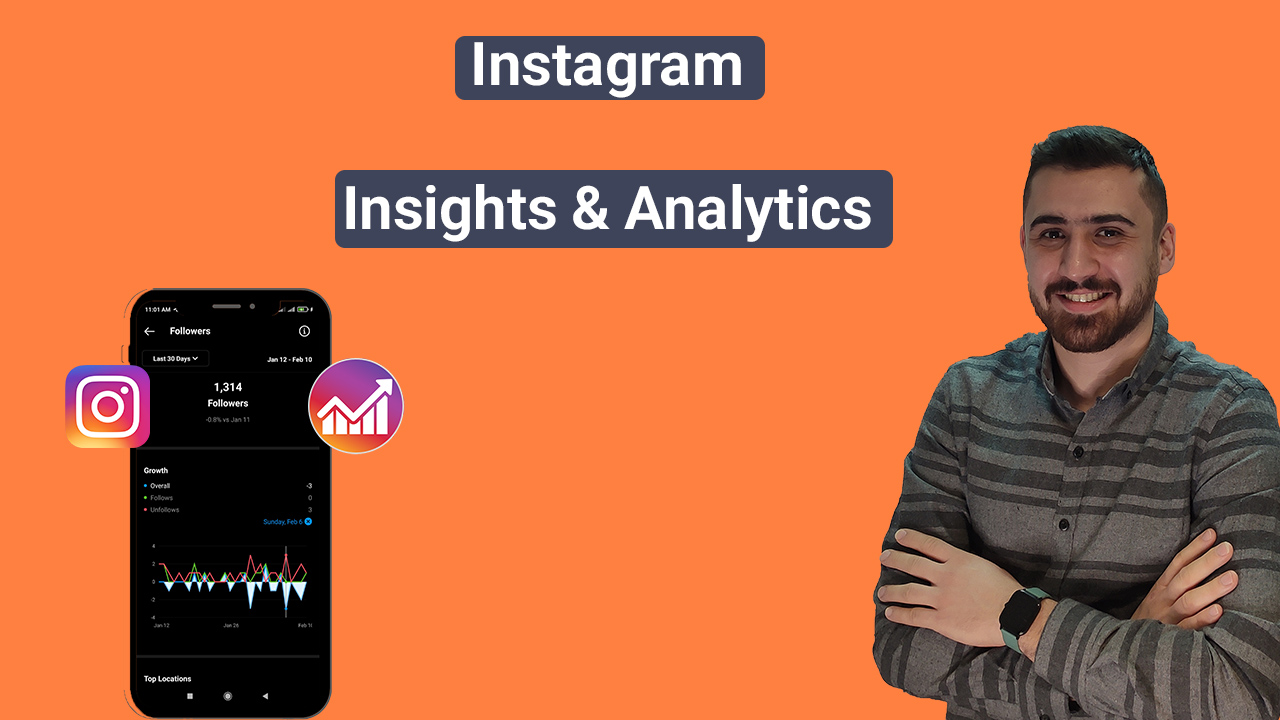
Is my instagram page doing well?!
How well do users reach out to my instagram posts?
What type of content generates more engagement?
If you’re wondering how to measure your instagram page performance and what metrics and kpis to track, you are in the right place.
I’m gonna talk about different insta metrics and I’ll teach you how to measure it.
If this is your first time reading my insights, make sure to subscribe in my YouTube channel and checkout my website to get the latest updates about Social media Analytics.
Instagram Metrics Levels
So today I’m gonna present a comprehensive list of instagram metrics.
We can group instagram metrics into 3 levels based on the user journey.
- Reach level (it’s about how well users seeing your content)
- Engagement level (it’s about how much those users that saw you content engage with it)
- Conversion level (it’s about how many of the engaged users, completed an action like purchase or sign up)
One more thing, I also separated account, post and story metrics and I’ll try to explain each metric a little bit but if you have any question please comment below so I can answer it.
Let’s take a look at each set of metrics
Instagram Reach Level Metrics
For Account metrics you should track:
- Account Reached : For reached accounts, make sure to check out (follower and non-follower ratio + number of reach of each content type) to get a better picture of who reaches out to your page and what they read out to.
- Follower count : Follower count is simply number of your follower over a specific time period
- Follower growth rate : Follower growth rate is equal to number of new followers divide by total followers times 100
- Unfollow rate : Unfollow rate is equal to number of unfollows divide by total followers times 100
For Post & story you should track both:
- Reach : In post insights you can check out follower and non follower ratio + the source of the post’s impression.
And
- Impression: In story insights however you can only see the number of reach and impressions.
Instagram Engagement Level Metrics
Account metrics you can track are:
- Account engagement rate : You can find out your account engagement rate using analytics tools or simply by calculating likes + comments + shares divided by followers.
- Social share of voice (SSoV): Social share of voice is your brand mention volume divided by volume of the whole industry mentions.
- Applause rate: Applause rate is calculated by number of approval actions like (share , like, comment and etc) divided by total number of followers.
- Amplification rate : Amplification rate is equal to total post shares divided by total followers
- Number of Bio link click (website traffic) : For Bio Click click you should track the traffic brought to your website from instagram and you can set UTM link
- virality rate : The Virality rate is equal to the number of shares divided by total impressions.
Now we are going to take a look at post engagement level metrics:
Post metrics you should track are:
- Post engagement rate: As I mentioned earlier, engagement rate is equal to + comments + shares of a post divided by number of followers times 100.
- Number of shares
- Number of saved
- profile visits from post
- Follows from post
You can find the rest of post engagement metrics in the post insights area.
For Stories we have two groups of metrics : navigational metrics and interaction metrics.
Navigational metrics is related to how users navigate in your stories and interaction maetrics is about how users interact with your stories.
Story (Navigation metrics) you should track are:
- Forward Taps
- Back Taps
- Next Story Swipes
- Exit Story Taps
and
And Story (Interactions metrics) are:
- Profile Visits
- Replies
- Follows
- Shares
- Website visits
- Sticker Taps
You can check out these metrics in the story insights area.
Last but certainly not least we have instagram conversion level metrics.
Conversion metrics are related to measuring how well users do the desired actions on your website for example.
Making a purchase and signup, are among the most important conversion actions.
Instagram Conversion Level Metrics
Metrics you should track are:
Since you can share clickable links in promoted instagram posts, you can track CTR and CPC.
- Conversion rate : Conversion rate is the number of conversions divided by the total link clicks times 100.
- Number of transactions: Number of transactions is simply the number of purchases made by Instagram users.
- Number of Signups: number of Signups is simply the number of sign ups by Instagram users.
- Revenue: Revenue is the Amount of Revenue made by Instagram users.
- CTR (for sponsored media post): CTR or Click through rate is the number of link clicks divided by the total impression times 100.
- CPC (for sponsored media post): And CPC or cost per click is the cost you pay for each click on your post’s link.
Alright, so We have covered 3 groups of instagram metrics based on user journey, and each business page can measure its performance based on the stage of their instagram page.
You can analyze metrics and drive insights by putting them together. I will be talking about Metrics and KPI analysis in a different video. Make sure to subscribe and turn on the notification to get notified for my next video.