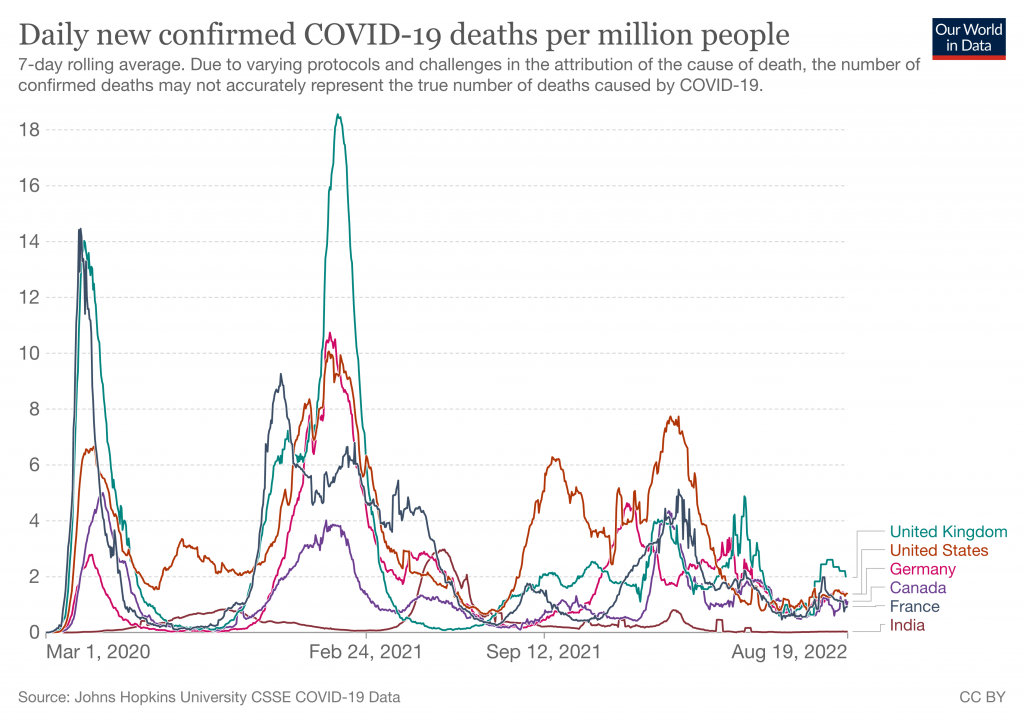
In this project I used the Coivd-19 death dataset and explored many weird and also sad stuff.
Again I’m using SQL to explore this dataset, I want to improve my SQL querying skills with another project.
About The Dataset

Coronavirus Pandemic has a large dataset in Our World In Data website and I used SQL to explore it.
Raw data on confirmed cases and deaths for all countries is sourced from the COVID-19 Data Repository by the Center for Systems Science and Engineering (CSSE) at Johns Hopkins University.
Here is the link to dataset itself:
https://ourworldindata.org/covid-deaths
This datasets updates constantly.
Data Exploration
First I created a data base then imported the data into Microsoft SQL Server and now I want to read it.
So I select the data that is not null.
Select *
From PortfolioProject..CovidDeaths
Where continent is not null
Next I will select the data I want to check out, ordering in Location and Date.
Select Location, date, total_cases, new_cases, total_deaths, population
From PortfolioProject..CovidDeaths
Where continent is not null
order by 1,2
Now I want to check out the total the total number of cases and death caused by Coivid-19 in United States.
Select Location, date, total_cases,total_deaths
From PortfolioProject..CovidDeaths
Where location like '%states%'
and continent is not null
order by 1,2
After that, I wanted to check that if someone get infected with Covid-19 on United States, what is the probability that he or she dies.
Select Location, date, total_cases,total_deaths, (total_deaths/total_cases)*100 as DeathPercentage
From PortfolioProject..CovidDeaths
Where location like '%states%'
and continent is not null
order by 1,2
Result :
Around 1.5%
Since the dataset updates, you might get a different number.
Next, I was curious about the infection rate of each country.
So I used aggregation function Max and called it H_InfectionCount and grouped the data by Location and Population and ordered descending.
Select Location, Population, MAX(total_cases) as H_InfectionCount,  Max((total_cases/population))*100 as PercentPopulationInfected
From PortfolioProject..CovidDeaths
Group by Location, Population
order by PercentPopulationInfected desc
Result:
Country : Montenegro , Infection rate: around 17%
Then I wanted to check things based on continents.
So, I tried to find out the which continent had the highest number of deaths per population
Select continent, MAX(cast(Total_deaths as int)) as TotalDeathCount
From PortfolioProject..CovidDeaths
Where continent is not null
Group by continent
order by TotalDeathCount desc
Result:
Continent : North America , Death Count: more than 570,000
After continent, I wanted to check out the global numbers.
So here is how I checked the Total Cases, Total Deaths, and the Death Percentage.
Select SUM(new_cases) as total_cases, SUM(cast(new_deaths as int)) as total_deaths, SUM(cast(new_deaths as int))/SUM(New_Cases)*100 as DeathPercentage
From PortfolioProject..CovidDeaths
where continent is not null
order by 1,2
Result:
Total Cases: Around 160 Million cases, Total Death: Around 4 Million Deaths, Death Percentage: Around 2%
I wanted to check the Percentage of Population that has received at least one Covid Vaccine
Select dea.continent, dea.location, dea.date, dea.population, vac.new_vaccinations
, SUM(CONVERT(int,vac.new_vaccinations)) OVER (Partition by dea.Location Order by dea.location, dea.Date) as RollingPeopleVaccinated
--, (RollingPeopleVaccinated/population)*100
From PortfolioProject..CovidDeaths dea
Join PortfolioProject..CovidVaccinations vac
	On dea.location = vac.location
	and dea.date = vac.date
where dea.continent is not null
order by 2,3


