In this project I used a dataset called Bank Marketing Dataset which was uploaded in Kaggle.
I used Power BI visualization tools and DAX to analyze and visualize the data.
About The Dataset
This dataset contains the data of more than 40,000 people who were targeted in the bank’s recent marketing campaign.
To be more specific, let’s read the explanation provided in dataset description :
“This data set contains records relevant to a direct marketing campaign of a Portuguese banking institution. The marketing campaign was executed through phone calls.
Often, more than one call needs to be made to a single client before they either decline or agree to a term deposit subscription. The classification goal is to predict if the client will subscribe (yes/no) to the term deposit (variable y).”
Here is the link of the dataset in Kaggle.com if you want to check it out:
https://www.kaggle.com/datasets/ruthgn/bank-marketing-data-set
About This Project
In this data analysis project with Power BI, I analyzed the data and grouped in into two main section:
- Audience of Campaign
- Performance of Campaign
In the first section I provided the dashboard and analysis about the audience of the campaign and in the second part I focused on the result and performance of the campaign based on different features.
Campaign Audience Analysis
In this section I analyzed the data using DAX and used visualization tools like bar and line charts to create a dashboard.
Personal Status
First let’s take a look at the personal status of people who were targeted in this campaign.
To create a dashboard I created many new measurements.
first one is simply the number of people and here is the code for that.
Number Of People = COUNT('bank-direct-marketing-campaigns'[job])After that I created many charts, for example for the bar chart of audience educations, I chose the number of people measurement in X axis and the education column in Y axis.
I did the same thing for martial status, age and job bar charts.
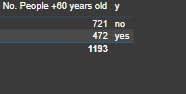
For more analysis in DAX, I used CALCULATE function. for example I used this function to find the number of people who were 60 years old or older.
Here is my code:
No. People +60 years old = CALCULATE(COUNT('bank-direct-marketing-campaigns'[age]),'bank-direct-marketing-campaigns'[age]=>60)Then I created a table using the new measurement above and the Y column that shows the status of audience which whether they subscribed a deposit term or not, to check out how many of those who are 60 years old or older, subscribed a deposit term.
Here is the first dashboard for personal status.
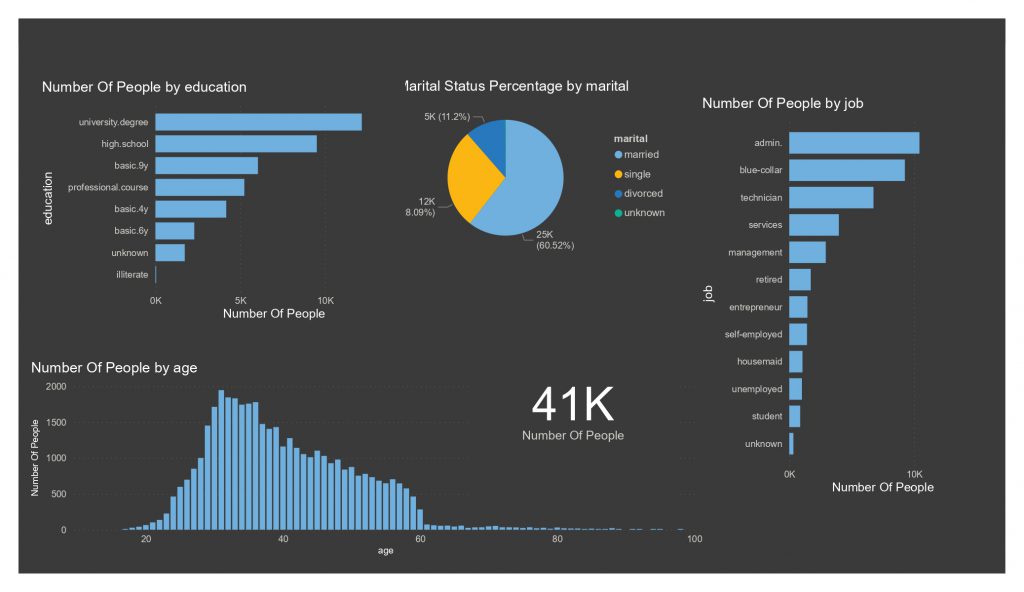
41,188 people were targeted in this campaign.
More than half of the audience of the campaign were aged between 30 to 40 years old.
People aged 31 years old, had the highest number of audience compared to others.
More than 60% of the audience were married.
Around 30% of the audience had a university degree.
Admin, Blue-Collar and Technician were the top 3 jobs that the audience of campaigns were doing.
More than 45% of those who were aged 60 years or older, subscribed to a term in this campaign.
Financial Status
Next, let’s check out the financial status of the audience.
I used DAX and new measurement just like the pervious section, and I analyzed the data then created the second dashboard.
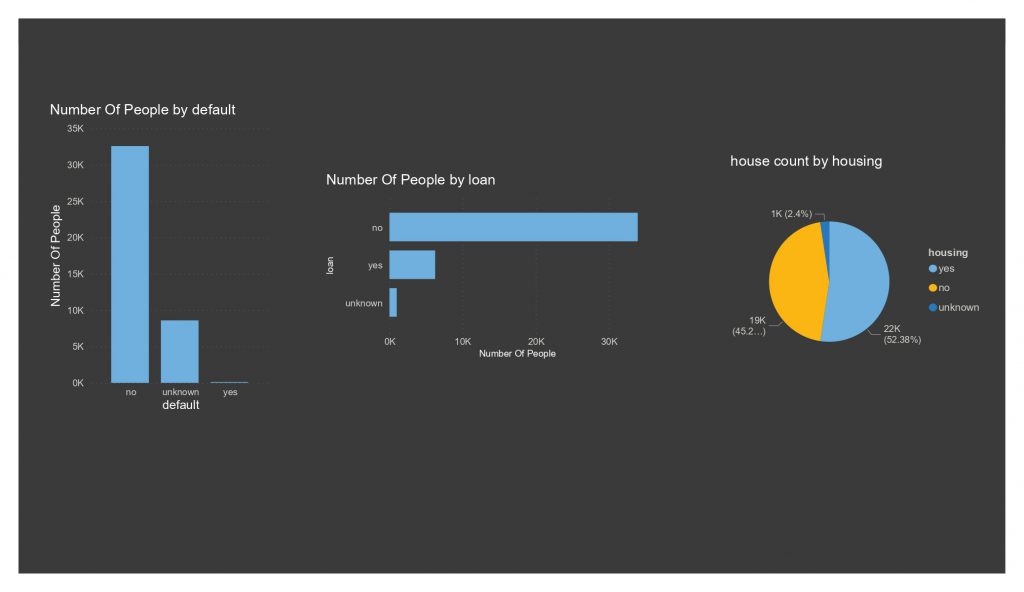
Almost none of the audience had already opened a credit account.
81% of the audience had no personal loan.
Around 46% of the audience did not have a house loan.
Only around 9% of the audience had both personal and house loans.
Around 6% percent of the audience had personal loans but didn’t have housing loans.
Around 44% percent of the audience had housing loans but didn’t have personal loans.
Only 12% of those who already have a house loan, subscribed to a term in this campaign.
Only 11% of those who already have a personal loan, subscribed to a term in this campaign.
Campaign Performance Analysis
In this phase I mostly used DAX and created many new measurements to analyze the data and got many interesting insights.
Then I used the visualization section and charts to create a dashboard for each section.
Campaign Overall Performance
First, let’s take a look at the overview of the campaign’s performance.
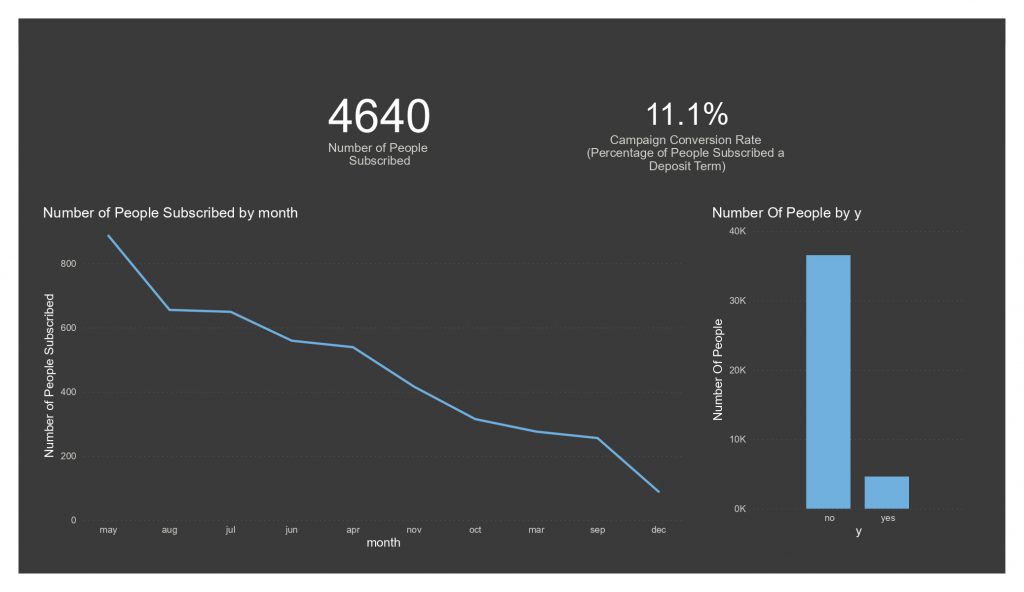
Around 11% percent of the 41,188 people who were targeted in this campaign converted and subscribed to a term deposit, which is 4,640 people.
Most of the subscription happened in May.
Campaign Performance Based on Type of Contact
Next, let’s take a look at contact communication type reports.
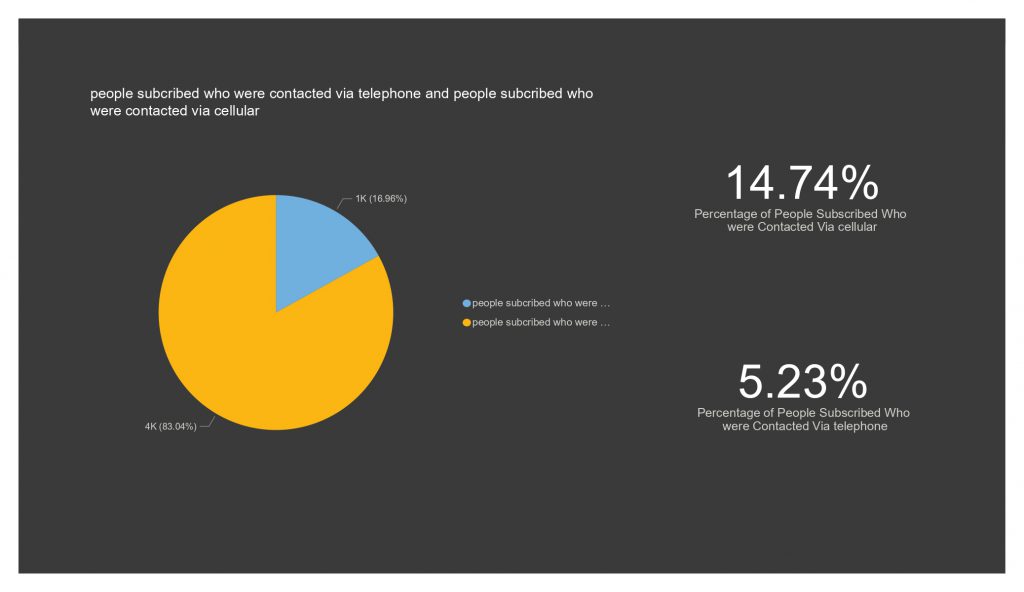
More than 83% of people who subscribed were contacted via cellular.
Conversion rate of the audience who were contacted via cellular is around 15%.
Conversion rate of the audience who were contacted via telephone is around 5%.
Campaign Performance Based on The Number of Calls Made
Now, I’m going to check out the number of contacts performed during this campaign.
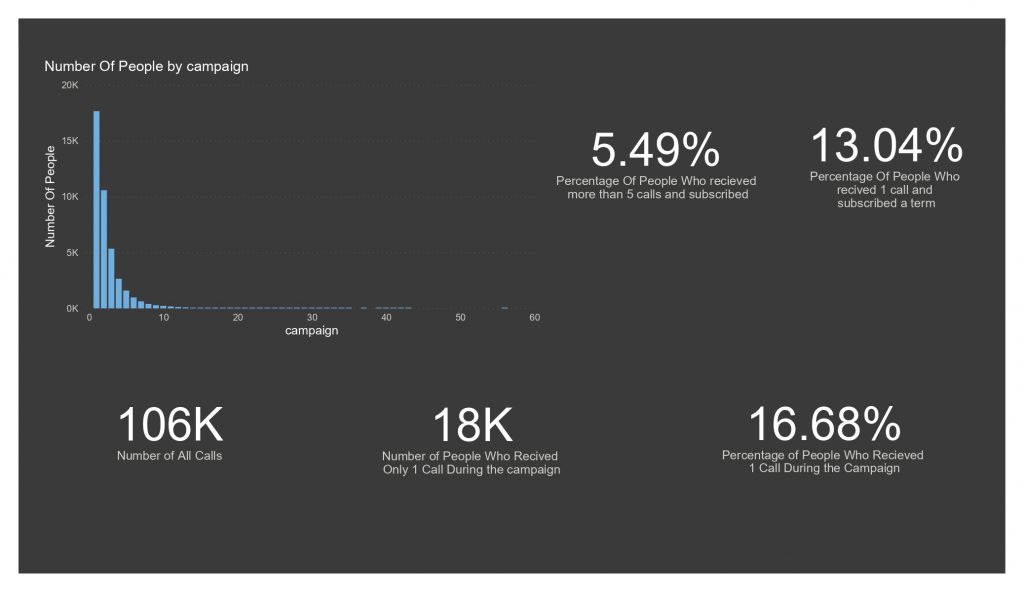
More than 106K calls have been made during the campaign.
Around 17% of the audience received only 1 call, which is around 18,000 people.
56 times, the maximum number of calls a person received during the campaign.
The conversion rate of those audience who received only 1 call is around 13%
The conversion rate of those audience who received more than 5 calls is around 6%
Campaign Performance Based on Last Contact Made
Next I lets see the number of contacts performed before this campaign and its effect on this campaign
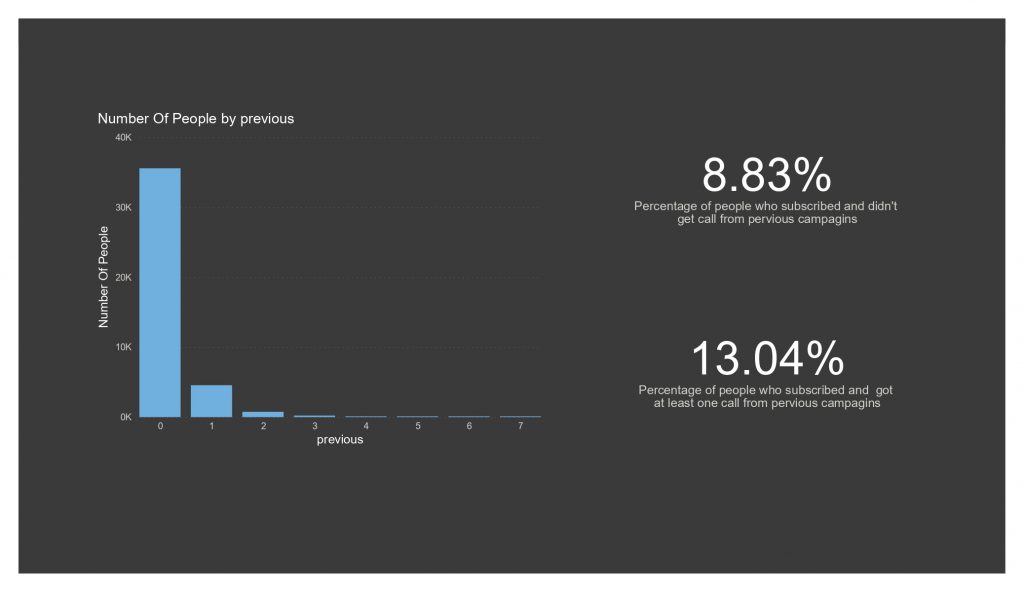
More than 86% of the audience weren’t contacted before this campaign.
The conversion rate of people who were contacted from previous campaigns is around 9%
The conversion rate of people who weren’t contacted from previous campaigns is more than 13%.
Campaign Performance Based on The Result of Previous Campaigns
Lastly, I check out the outcome of the previous marketing campaigns and its effect on the performance of this campaign.
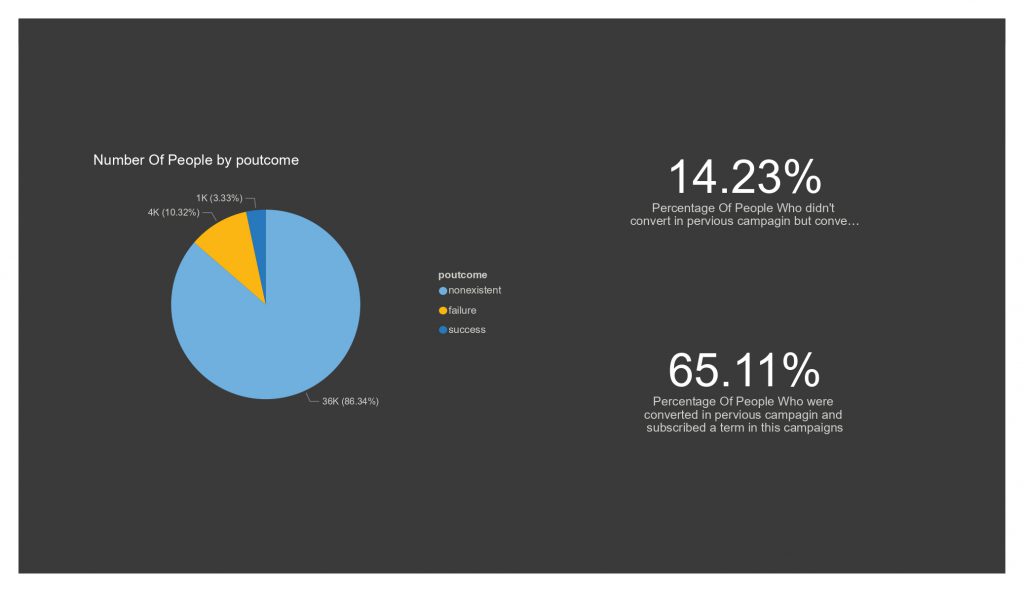
More than 86% of the audience were not part of any previous campaigns.
More than 65% of people who were converted in previous campaigns, also were converted in this campaign too.
More than 14% of people who weren’t converted in previous campaigns, but were converted in this campaign.
Conclusion & Insights
As I mentioned above, I used DAX to analyze data and extract insights from it and used the visualization tools like bar and line charts to create dashboards for each section.
So, in this section I will share my analytics opinion and the insights I extracted from the data.
I analyzed the data as if I want to launch another campaign. I will be able to use those insights to increase performance and effectiveness of the future campaigns.
First, let’s check out the audience analysis results and create out persona or personas of buyers for next campaigns.
As you can see, people aged 60 years or older subscribed to a deposit term, more than others.
Besides that people who already had personal or housing loans don’t seem to be interested in subscribing to a deposit term.
So for future similar campaigns with the same kind of goals, I won’t be targeting people who already have personal or housing loans and I’ll try to target people aged 60 or older.
Next let’s talk about how to contact people, I will be contacting the audience via cellular because it has a higher conversion rate and telephone.
About the number of contacts, we can see that people who received 1 call had a higher conversion rate than those who were contacted more than 5 times.
So in future campaigns we shouldn’t make more than 5 contacts and it’s better to keep it less than that.
Another thing which is important is the history of the audience with the bank because those who weren’t contacted before had higher conversion rate compared to those who were contacted.
But since the difference isn’t much we can check out the result of previous campaigns too and see if it has a meaningful effect.
We can see that more than 65% of those who were successfully converted in previous campaigns, also converted in this campaign too.
So it gives us this hint that for future campaigns I should be focusing more on those that were converted in previous campaigns and less on who’s who don’t.
In this data analysis project with Power BI I tried to analyze and visualize data in order to get useful insights.
Please comment your opinions below and share the video with anyone who might need it.