How an I.T. Company Achieved a 100% Increase in Revenue in Just 60 Days: A Real-Life Success Story
In this article, I will provide an insight of how a remarkable 100% revenue boost was accomplished within a mere 60-day period at an I.T. company which was one of my projects.
Through this firsthand experience, I will shed light on the strategies and events that led to this impressive growth in revenue.
Note: I can’t share the name of the company or any sensitive data because of privacy policies, so I will call the company X and the data is shared with the same coefficient but different from the real data.
Project Overview
Company X is an online retailer operating in the Middle East.
As part of a performance marketing project for the company, I was briefed about a task with a main question, how to increase the revenue of the company by at least 100% in a short period (100 days)?
This is how I proceed:
- First I defined the problem/question, which was how to increase the revenue of the company by 100% in a short period?
- Next, I builded an issue tree and listed all the factors that could have an effect on increasing revenue
- Lastly, I created a work plan to and listed things like the issue, hypotheses, analysis needs to be done, data sources, duration and the next step needs to be done
1st Step : DefinIng the Problem or Question
The question is clear, how to increase the revenue of the company by 100%?
Let’s go to the next step!
2nd Step : Building an Issue Tree
To list all the factors that could have an effect on the company’s revenue, we should investigate different user flows and behaviors.
Since the company’s business is online retail through a website,
I should check the online user flow.
User Journey Scenario 1
So now let’s check out a sample journey of a user who buys something from the company’s website via Google organic search.
User sees company X title and description on google result page (SERP) >>> then the user checkouts the results in Google’s first page and chooses company X website
>>> then he lands on the iPhone 13’s page on the company X website and he checks the price, information, shipping methods and ect.
>>> then the user clicks on “order now” button and that directs him to purchase first step which is add to cart
>>> next he finishes the process and then he goes to check out step and finally he makes the payment
User Journey Scenario 2
Next is a sample journey of a user who buys something from the company’s website via Google paid ads.
User sees a display ad about “iPhone 13 promotion” in website or app
>>> then the user shows interest and and clicks on the ad
>>> then he lands on the iPhone 13’s page on the company X website and he checks the price, information, shipping methods and ect.
>>> then the user clicks on “order now” button and that directs him to purchase first step which is add to card
>>> he finishes the process and then he goes to check out step and finally he makes the payment
User Journey Scenario 3
Another journey is a sample journey of a user who buys something from the company’s website via Social media, Instagram to be specific.
User sees company X instagram post ad
>>> then the user checkouts the post and clicks on the CTA
>>> then he lands on the iPhone 13’s page on the company X website and he checks the price, information, shipping methods and ect.
>>> then the user clicks on “order now” button and that directs him to purchase first step which is add to card
>>> he finishes the process and then he goes to check out step and finally he makes the payment
User Journey Scenario 4
Next is the sample journey of a user who buys something from the company’s website directly.
User enters to website of company X directly from his browser by entered its url address
>>> then the user searches iPhone 13 and clicks on the result
>>> then he lands on the iPhone 13’s page on the company X website and he checks the price, information, shipping methods and ect.
>>> then the user clicks on “order now” button and that directs him to purchase first step which is add to card
>>> he finishes the process and then he goes to check out step and finally he makes the payment
We can write down many more sample user flows, but the criteria affecting the company’s revenue would be the same.
Primary website events through the user journey of buyers:
- Entering the website
- Reaching out to product pages
- Checking out the product price and info
- Ordering the product and entering add to cart page
- Going forward and proceed to checkout page
- Making the payment
The Revenue for Company X would be calculated through this formula:
Revenue = Number of transactions * Avg Order Value (AOV)
Next, I used the formula and the user journey from entering the website till the final action which is making the payment, to rewrite the formula with more details.
Let’s say around 1000 users (assuming each session generated by a particular user) entered the home page of the website and only 5 users (0.5% conversion rate) made a purchase!
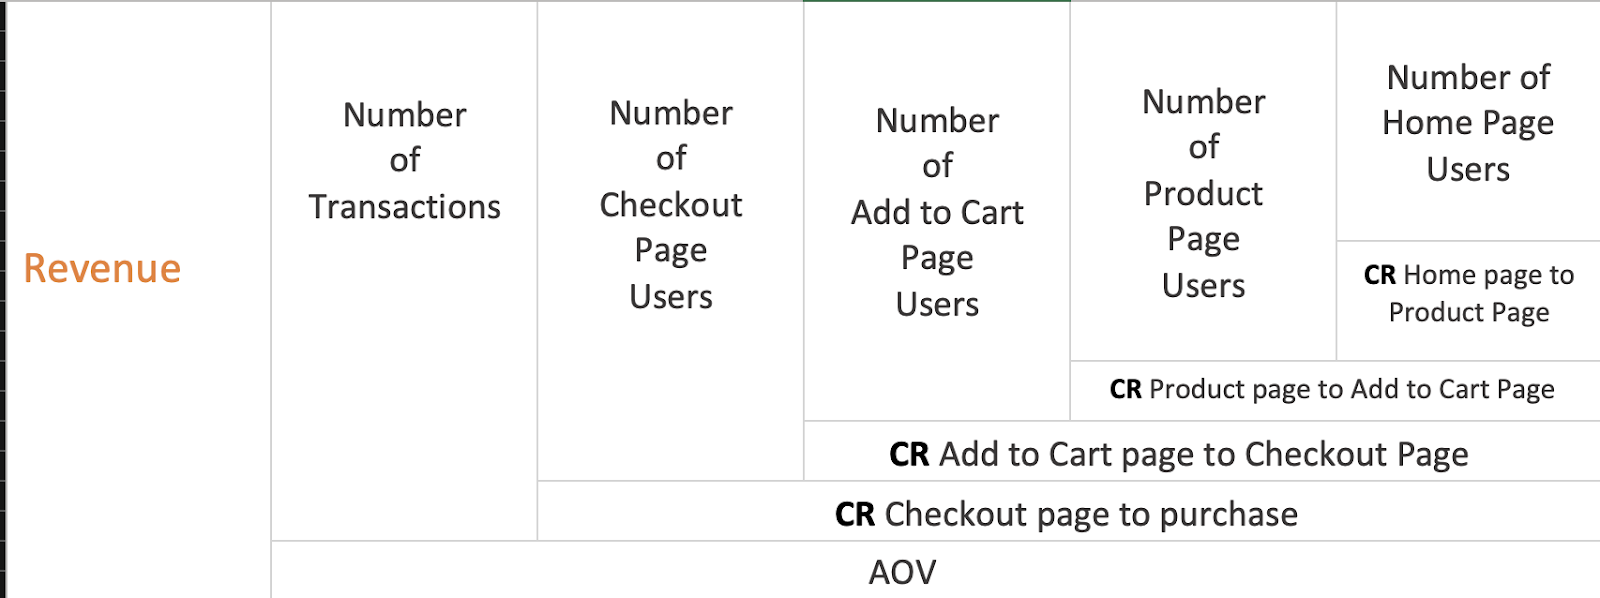
In the image below we are going to see their user journey from home page to purchase. Based on that we can write down the more detailed formula that will help us create the issue tree.
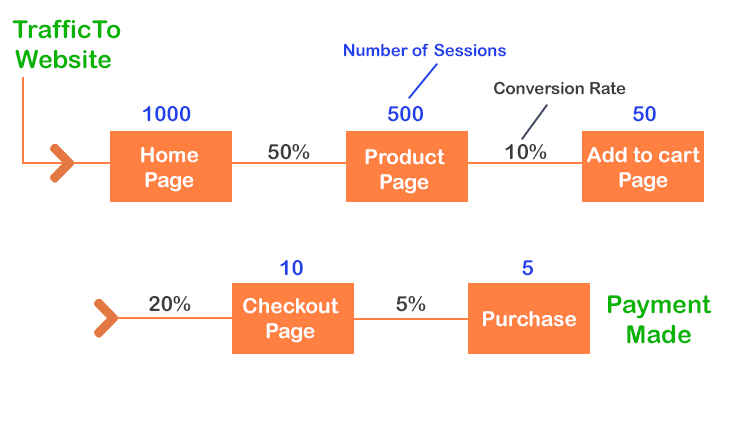
Note: CR is conversion rate and a session initiates when a user either opens your app in the foreground or views a page or screen and no session is currently active in Google Analytics 4.
Company X Revenue Formula Break Down Into Details
The formula was rewrote 4 times and went through more details each time.
Revenue = Number of transactions * Avg Order Value (AOV)
= (Number of sessions in checkout page) * (CR checkout TO purchase) (AOV)
= (Number of sessions in add to cart page) * (CR add to cart TO checkout) (CR checkout TO purchase) (AOV)
= (Number of sessions in product page) * (CR product TO add to cart) (CR add to cart TO checkout) (CR checkout TO purchase) (AOV)
= (Number of sessions in home page) * (CR home TO product) (CR product TO add to cart) (CR add to cart TO checkout) (CR checkout TO purchase) (AOV)
All of these 5 formulas are the same and will have the same numeric result but the details in the formula are different.
Now, I know which the criteria will directly affect the revenue of the company through the website based on the user journey.
So here is the issue tree for this issue or question of company X:
Table Issue Tree Based on The Formula
3rd Step : Creating a Work Plan
Next, I created a work plan to list all the possible solutions for the problem defined in the first step.
To manage the process and reach the solution in the most efficient way, I list some other things that we need to write.
The work plan document should contains these factors:
- Questions / Issues : listing all the possible scenarios that could be the answer of the main question
- Hypotheses : listing different theories or solutions that could make each scenarios possible
- Analysis : listing all the analysis needs to be done in order to assess each hypotheses
- Sources : listing all the data source that need to be accessed for the analysis process
- Responsibility : listing the teams or individuals who is responsible for each task
- Action : actions to be done if the hypothesis is true
First, I listed the all the possible scenarios:
- Increasing number of website traffic (increasing the home page and or product page user)
- Increasing conversion rate (home page to product page)
- Increasing conversion rate (product page to add to cart page)
- Increasing conversion rate (add to cart page to checkout page)
- Increasing conversion rate (checkout page to purchase)
Next I created work plan for each scenario and in the following table you can see a work plan for the first scenario :

I did the same for all other scenarios and created a work plan.
This way I was able to break down scenarios into separate tasks which will complete the puzzle, it also helped me to see more clearly all the available options.
How did I use the problem solving techniques to increase the revenue?!
Using this process I was able to see all the available factors and options to reach the goal.
In this process, one of the main stages was investigating each hypothesis based on the current and previous data, reports and analysis.
In other words, all the decisions were made through a data driven process which was made using solving techniques.
In general, I find out that I have 3 main option to increase the revenue:
1. Increase the website traffic while maintaining the conversion rates
2. Increasing conversion rates, maintaining the website traffic
3. Increasing both website traffic and conversion rates simultaneously
After carefully checking all the options, I chose the 3rd option!
So among all the options, this is how I increased website traffic :
- Launched 5 Google ads (search & display) campaigns
- Launched 8 email marketing campaigns
- Launched 4 social media campaigns
Using these campaigns, I was able to increase website traffic by 280% in 60 days.
And this is how I increased conversion rates :
- Increased the conversion rate of product page to add to cart page
- Increased the conversion rate of add to cart page to checkout page
- Increased the conversion rate of checkout page to purchase
Using different marketing experiments like A/B Testing, I was able to increase website total conversion rate by 40% in 60 days.
Overally, I was able to increase website traffic by 280% , website total conversion rate by 40% and consequently I boosted the revenue by 100% in just 60 days.