Report Introduction
Naked Furniture is a producer and seller of wooden furniture made with Canadian Wood. The Main store is based in Toronto, Canada with more than 50 years of experience.
Google Ads is one of the marketing channels that brings users to their website.
So I decided to measure the performance of google search ads campaigns for 1 year so I downloaded the data and analyzed it to get insights and use it to optimize future campaigns.
In this report I brought some of the insights I extracted from the data and mentioned my analytics opinions on each of them.
I used Pandas library in Python and Excel functions to analyze and visualize the data.
I did most of the analysis using Python and Pandas I visualized the data using Excel.
Report General Findings
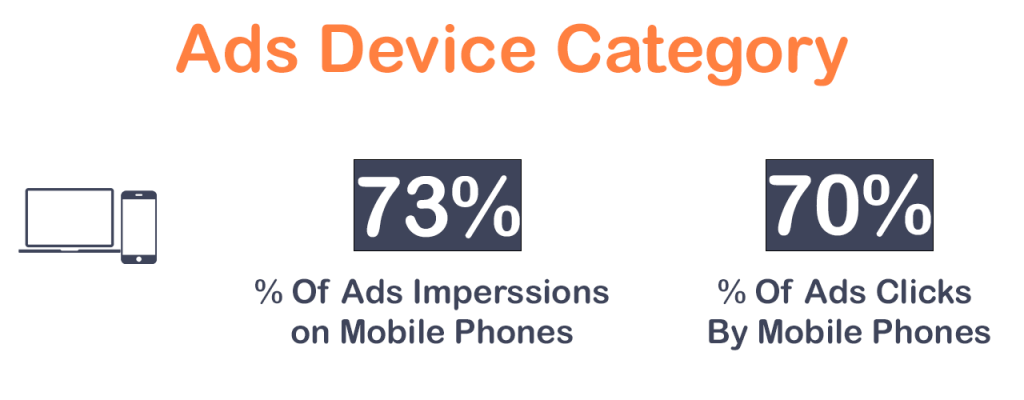
Ads Device category
I imported the data into excel and used COUNTIF function to count the number of mobile devices in the device category, and then divided by the total number of devices to get the mobile device portion.
So as you can see more than 70% of ads are shown in mobile devices so it’s quiet expected to have more clicks on ads from mobile devices too.
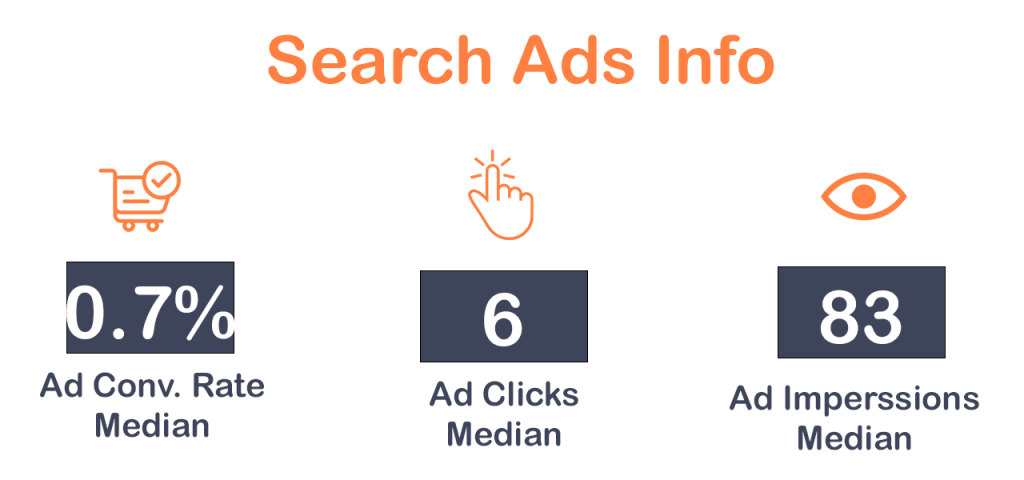
Search Ads Info
Next, let’s take a look at the median of impressions , clicks and Conversion rate of ads.
I used MEDIAN to calculate the median of each metric, if you wonder why did I use median and not average please read the research methodology of this article.
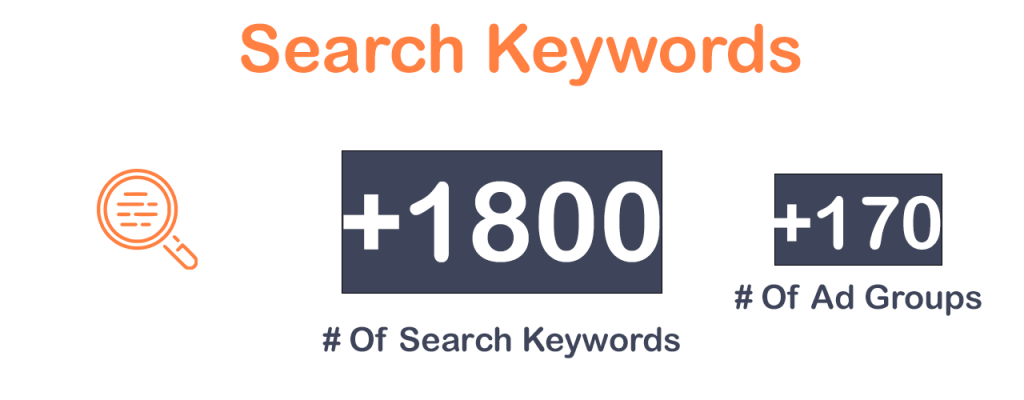
Keywords
In the period of this more than 1800 search keywords were used in different ad groups of different campaigns.
Section 1 : Audience
The information about audience of campaigns that are shared here, is about those audience who showed interest on ads(clicked on ads).
I FILTERED the data and analyzed the data for those who clicked on Ads.
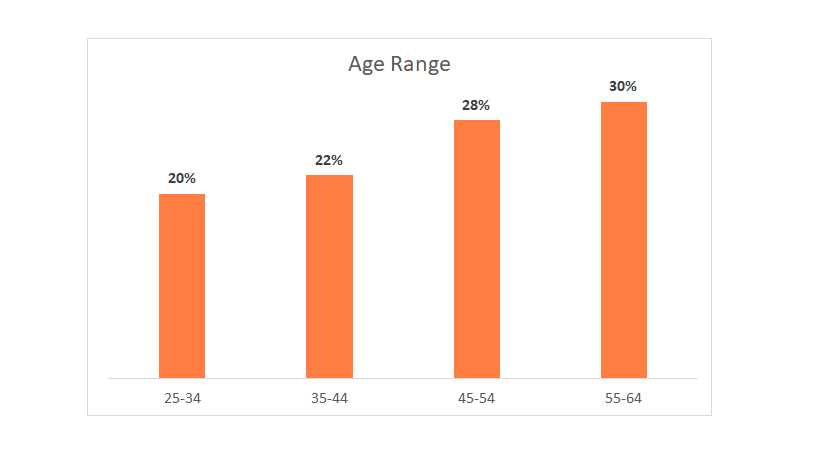
Age Range
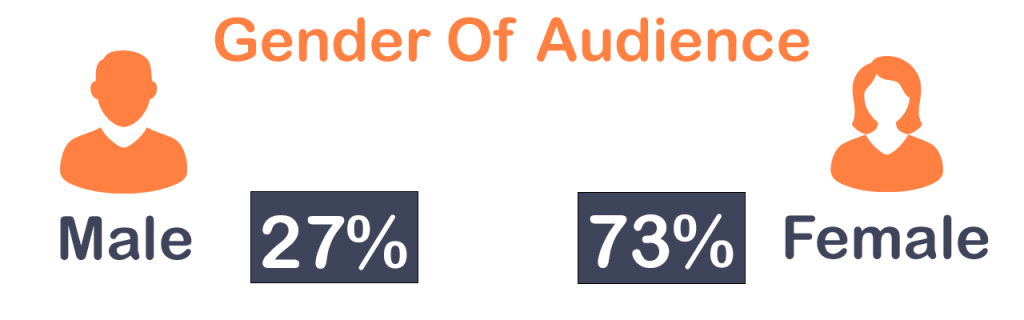
Gender
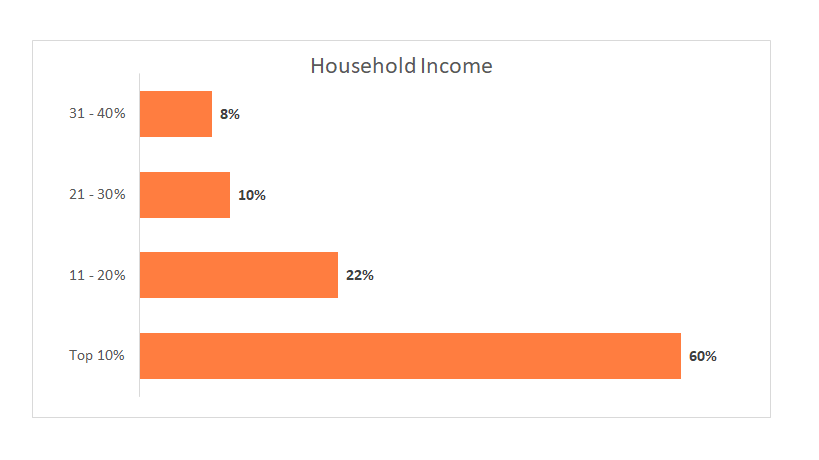
Household Income
Audience Analysis
It’s interesting that more than 50% of the users who clicked on ads are 45 years old and older, so we can assume that this type of products (Handmade Furniture) are not really attractive for younger generations and the business should focus more on middle aged users.
Besides that, we can see that women are really interested in this type of products and only 27% of all audiences are men.
Furthermore , it’s obvious that we are dealing with expensive products since 60% of users are in the top 10% of household income.
So it’s quite clear from the data that Women above 55 years old who are in the top 10% of household income, are one of the most important customer segments that the business can focus on.
Section 2 : Day & Hour
Ads Impression Report
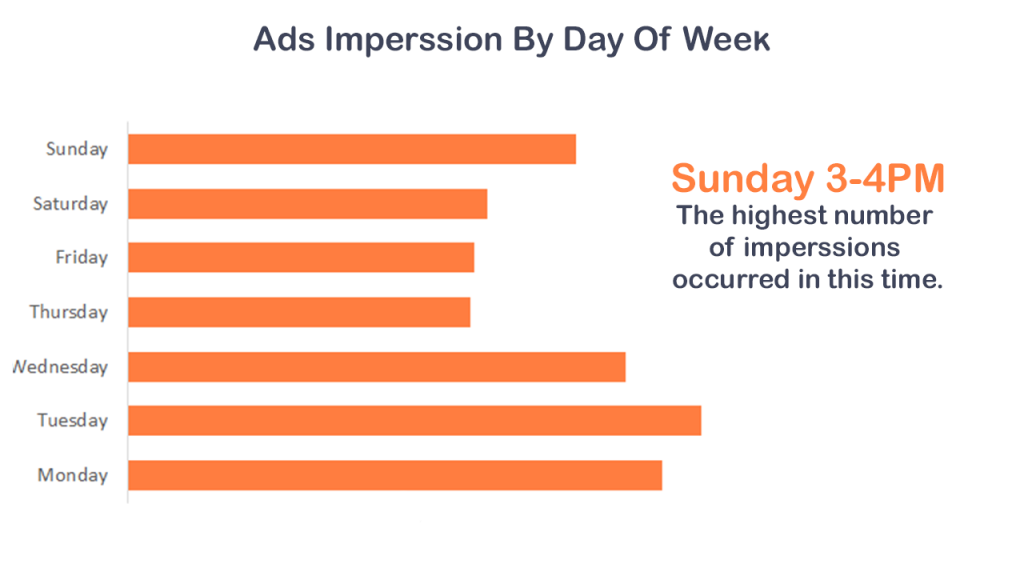
Ads Impressions By Day Of Week
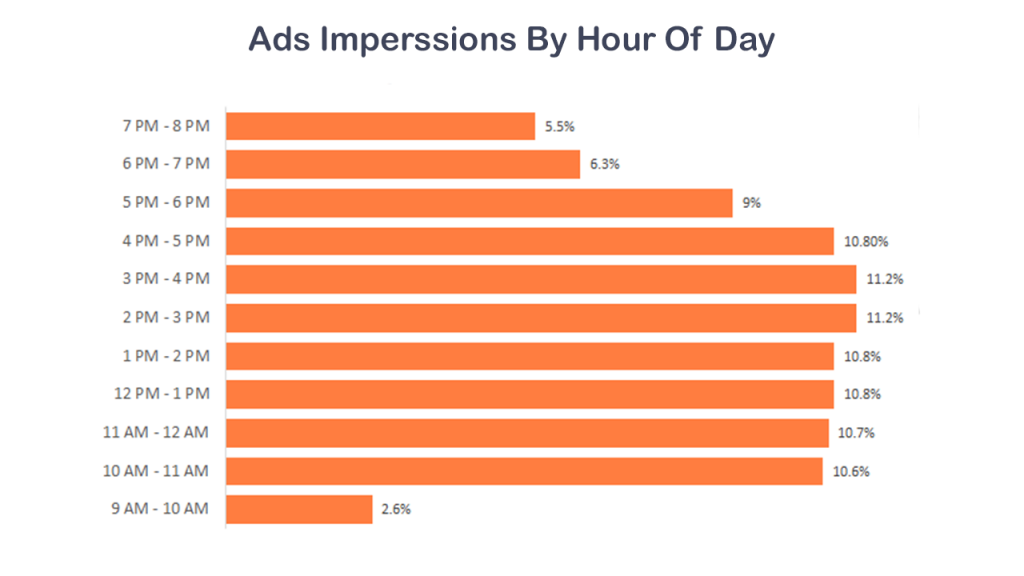
Ads Impressions By Hour Of Day
Ads Conversion Report
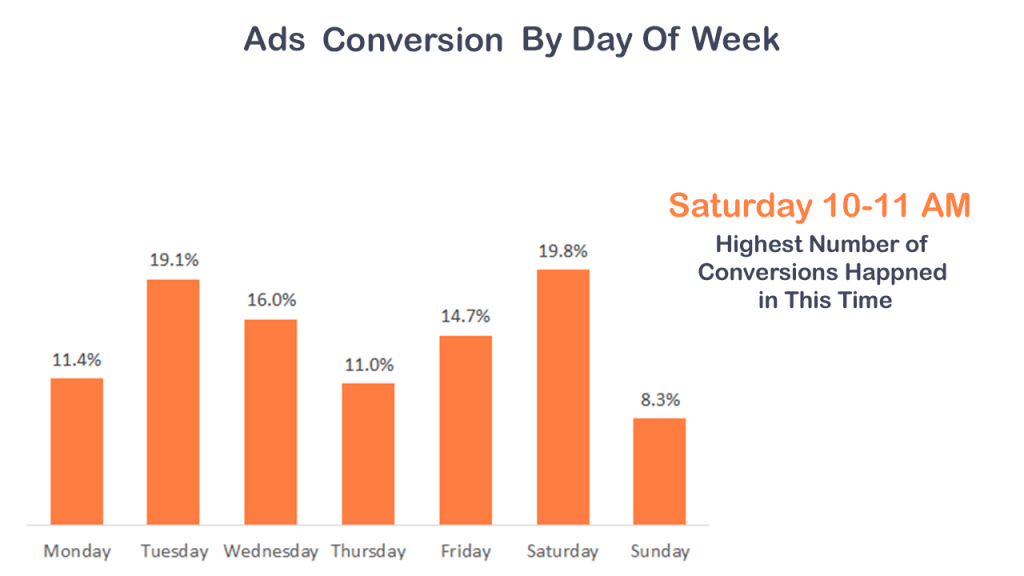
Ads Conversion By Day Of Week
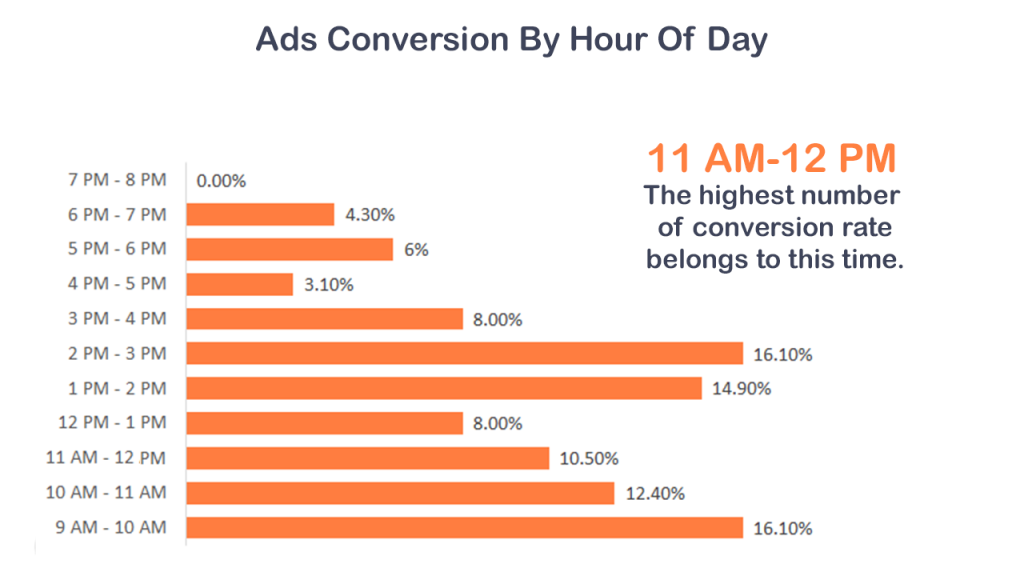
Ads Conversion By Hour Of Day
Ads Day & Hour Analysis
First let’s assume that the ads are qualified to show up and the more ads impressions means more searches generated by users.
Although the highest number of ad impressions occurred on Sunday, as you can analyze further, most of the searches happened during the week, on Tuesday and Monday and the common time to search is around 2 PM to 4 PM.
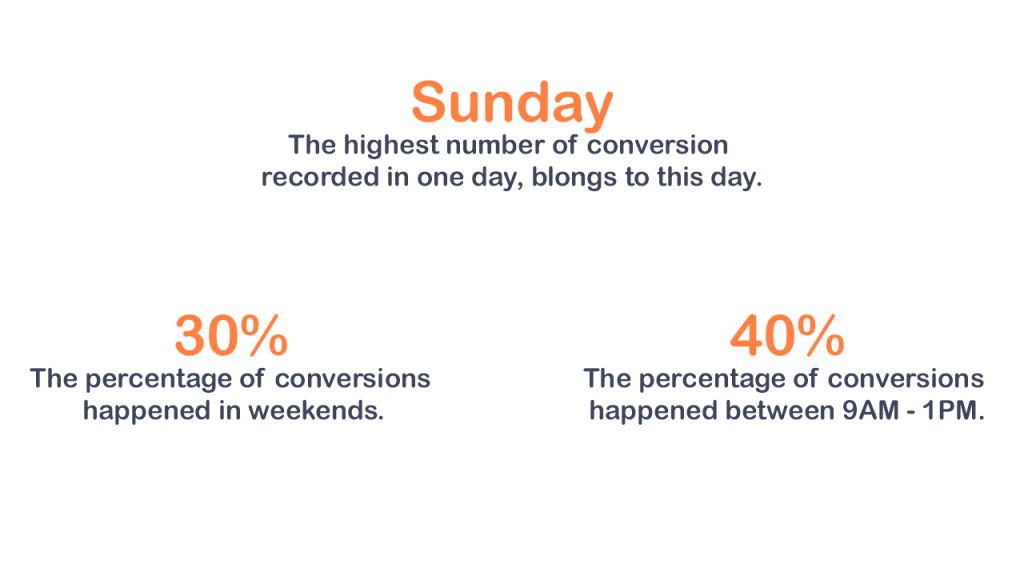
Checking out the conversion charts, we can see that the most number of conversions happened in saturday.
Based on these data we can say that some users search more often during the week but they don’t make purchases then, probably they are just gathering information and then on the weekend when they have more time to make decisions, they make their purchase.
Furthermore, we can see in impression and conversion charts that 2 PM to 3 PM is an important time frame that many searches and conversions happen during this time.
The most number of conversions though happened between 9 AM to 1 PM, so we should keep these time frames in mind when we are using new campaigns.
Section 3: Search Keywords
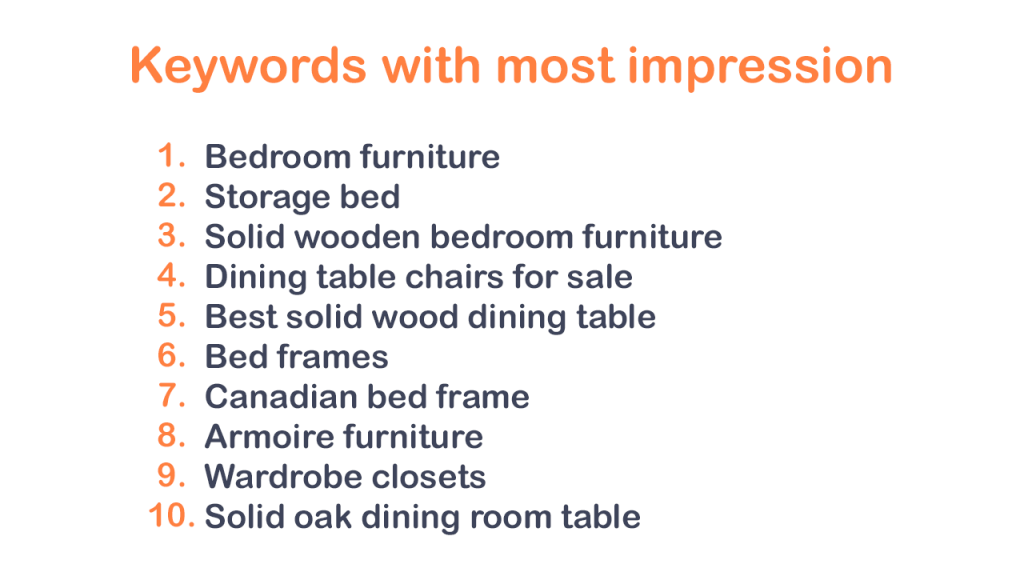
Keywords with most impression
In this section I used Pandas library in Python, to find the keywords with most impressions.
Code in Pandas:
import pandas as pd

df = pd.read_csv('Search keyword.csv', index_col=0)

df2= pd.to_numeric(df.Imperssions ,errors ='coerce')

df2.nlargest(n=10)
Outcome:
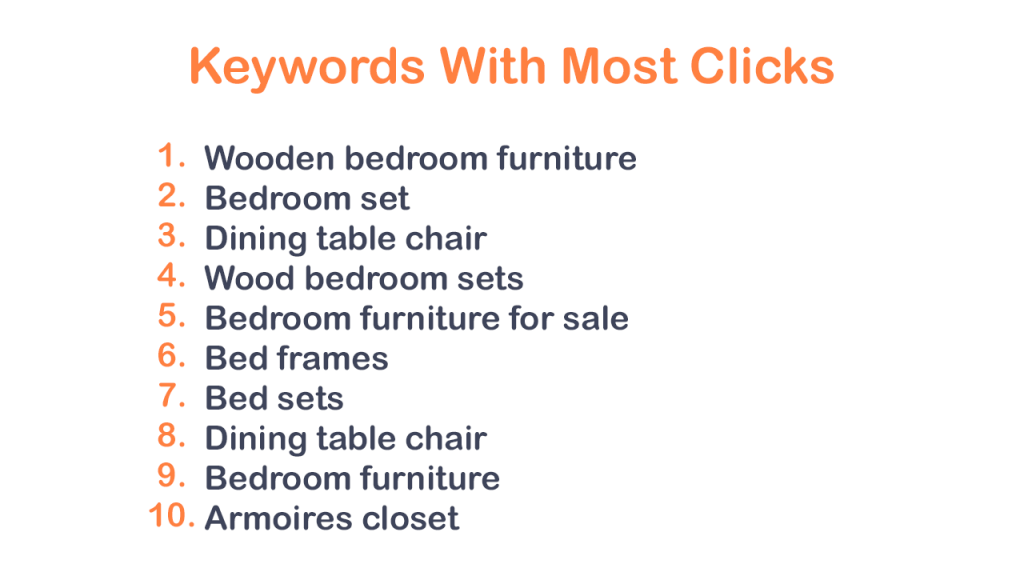
Keywords with most clicks
I did same to find the keywords with most clicks.
Code:
import pandas as pd

df = pd.read_csv('Search keyword.csv', index_col=0)

df2= pd.to_numeric(df.Clicks ,errors ='coerce')

df2.nlargest(n=10)
Outcome:
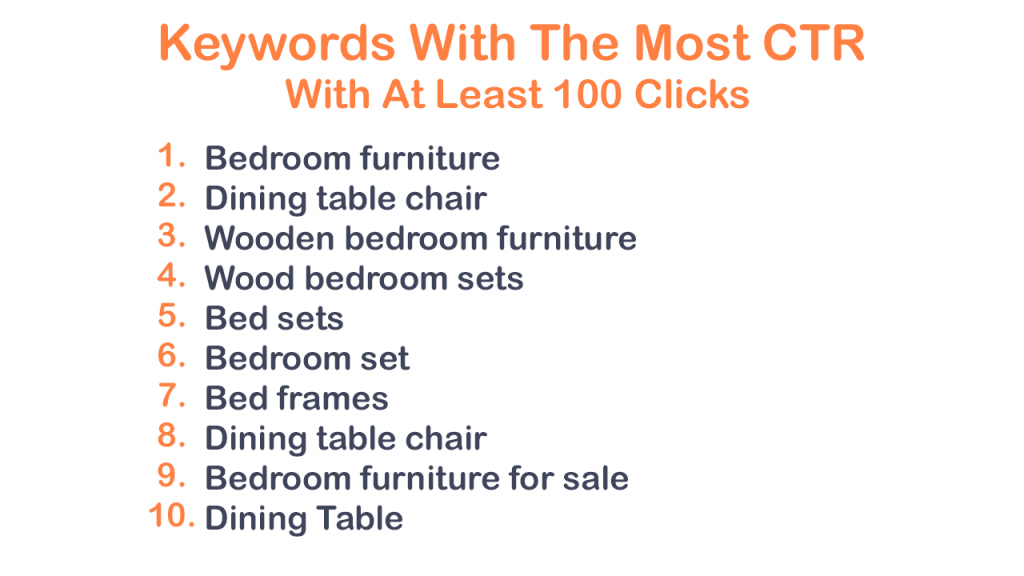
Keywords with most CTR with at least 100 clicks
Next, I used Pandas to Find keywords with highest number of CTR that Got at least 100 clicks.
Code:
import pandas as pd

df = pd.read_csv('Search keyword.csv', index_col=0)

df2= pd.to_numeric(df.Impressions ,errors ='coerce')
df3 = pd.to_numeric(df.Clicks ,errors ='coerce')

df4= df2.nlargest(n=10)

df5 = df3.loc[(df3 = 100)]

df6 = df['Search-keyword']

for keyword in df6:
  if keyword is in (df4) & (df5):
    print(keyword)
Output:
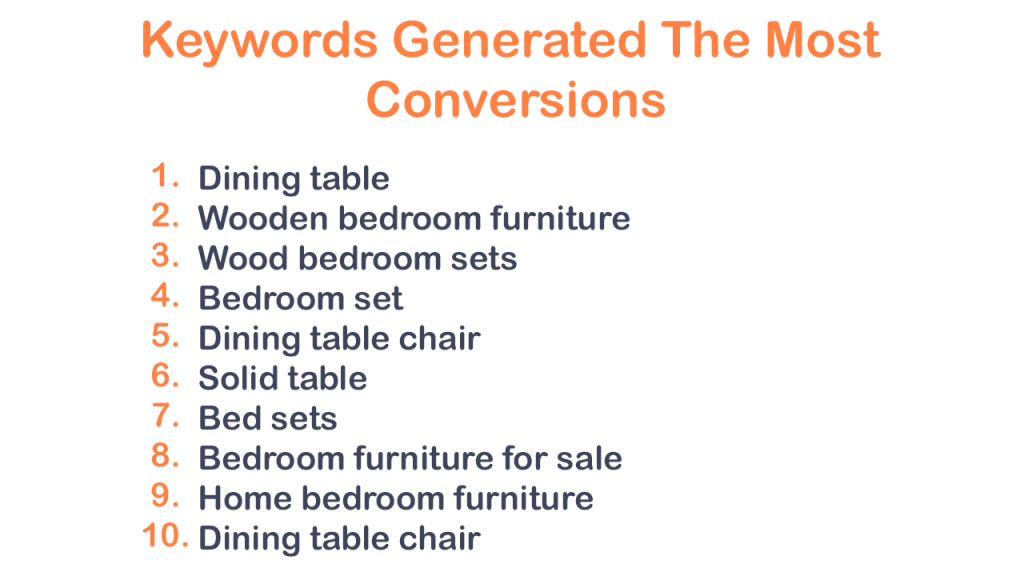
Keywords that generated most conversions
Next, I used Pandas to see the list of keywords that generated the most numbers of conversions.
Code:
import pandas as pd

df = pd.read_csv('Search keyword.csv', index_col=0)

df2= pd.to_numeric(df.Conversions ,errors ='coerce')

df2.nlargest(n=10)
Output:
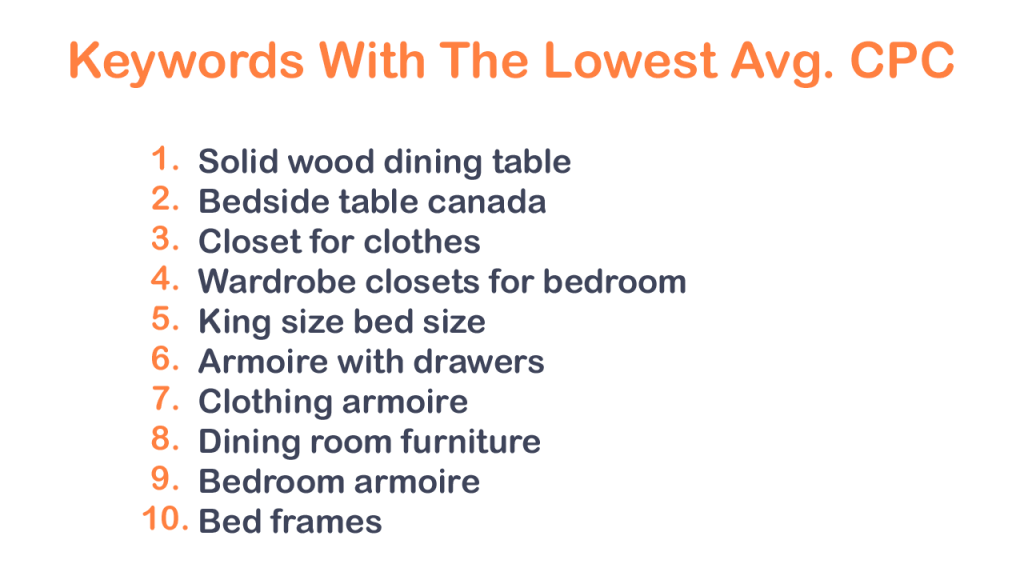
Keywords with lowest Avg. CPC
Beside that, I wanted to check out keywords that had lowest Avg. CPC.
Code:
import pandas as pd

df = pd.read_csv('Search keyword.csv', index_col=0)

df2= pd.to_numeric(df ['Avg-CPC'] ,errors ='coerce')

df2.nsmallest(n=10)
Output:
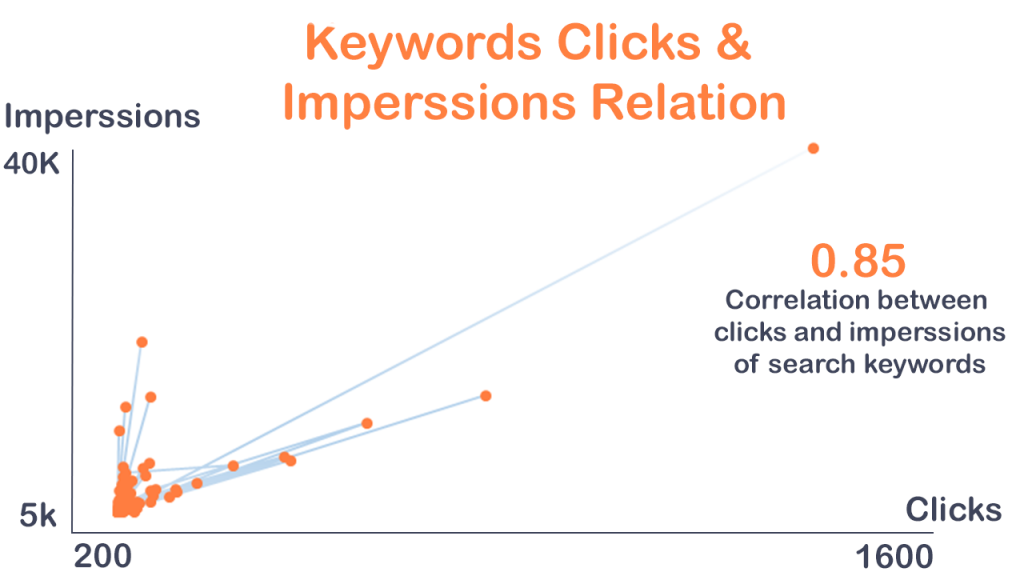
Clicks and Impressions relation of Search Keywords
I used Pandas to calculate the correlation and used the number of clicks and impressions to plot it in Excel using scatter plot.
Code in Pandas:
import pandas as pd

df = pd.read_csv('Search keyword.csv', index_col=0)

df2= pd.to_numeric(df['Impressions'] ,errors ='coerce')
df3 = pd.to_numeric(df.Conversions ,errors ='coerce')

corr=df2.corr(df3)
Output:
Search Keywords Analysis
Search Keywords are those keywords that we list for campaigns and search terms are those actual words the users search on the web.
Among the search keywords with the most impressions, only one keyword is in the list of keywords with the most number of clicks. It could mean different things. First, the search keywords in most impression lists didn’t really match with the search term the user entered. Second, the keyword match type of keywords in the impression list were too broad. Third, the title and description of ads weren’t related, attractive and so on, but remember there are more than 1800 keywords so this scenario will likely apply to these keywords only.
80% of Search keywords with the most CTR are in the list of keywords which generated the most conversions too. It shows that what is offered in the landing page is very close to what users are looking for and it’s a great sign. To be more specific, search keywords with the highest CTR, tells us that the ads are well designed for the need of users and that’s why when the users see the ads they will click on it and so in the next step when they have a great experience in the landing page too, they decide to complete the final action which is the conversion.
What is a golden search keyword? If a keyword exists in the last 3 lists, I’ll call it golden because it has the highest CTR and Conversion with the lowest CPC.
Although many of top impression keywords weren’t in the list of keywords with most clicks but we are talking about more than 1800 keywords and those 10 keywords are just the top keywords and in the last chart of this section we can see that search keywords clicks and impression have quiet strong correlation which is a good sign because it shows that new keywords are aligned with the users needs
Section 4: Search Ads
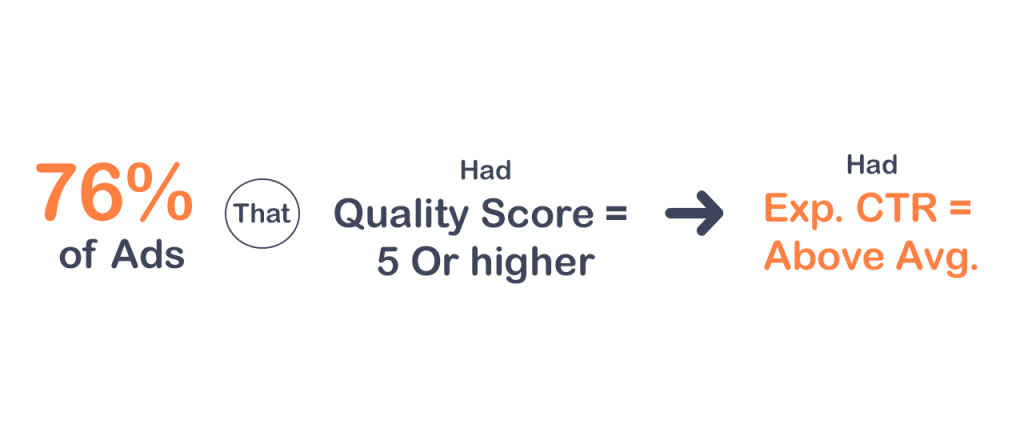
Quality Score and Exp. CTR Relation
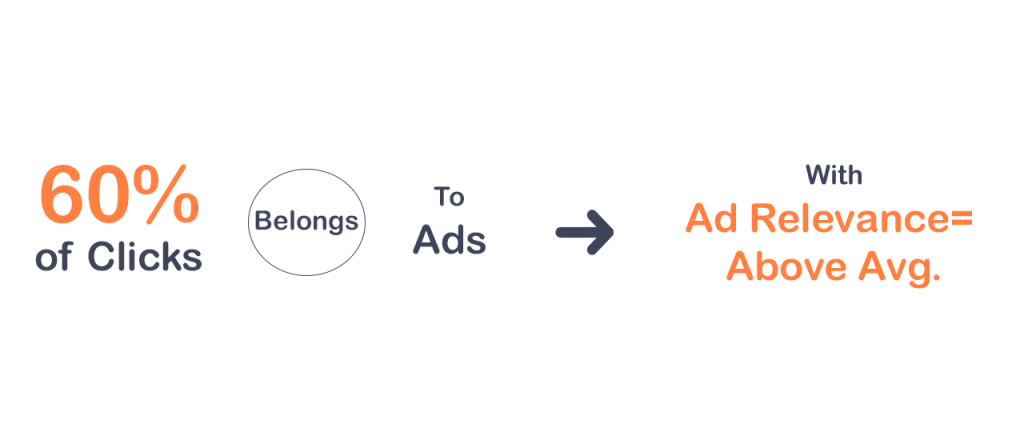
Ad Relevance and Number Of Clicks Relation
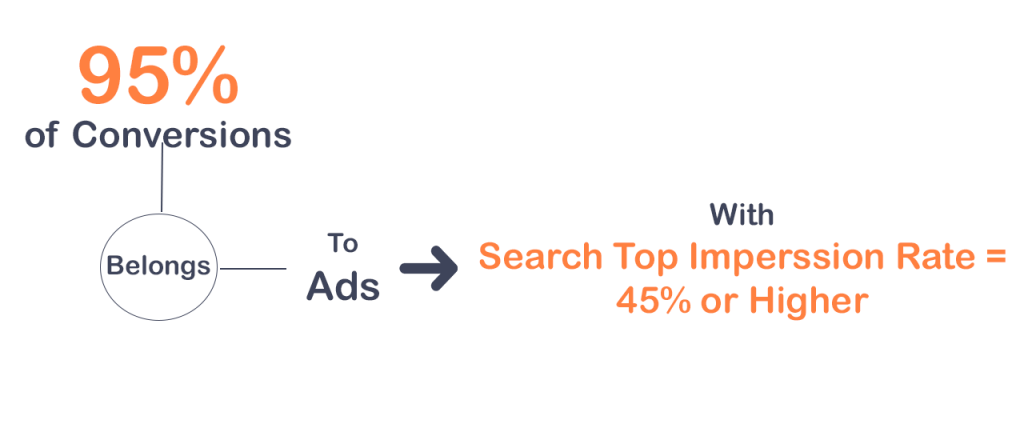
Search Top Impression Rate and Conversions relations
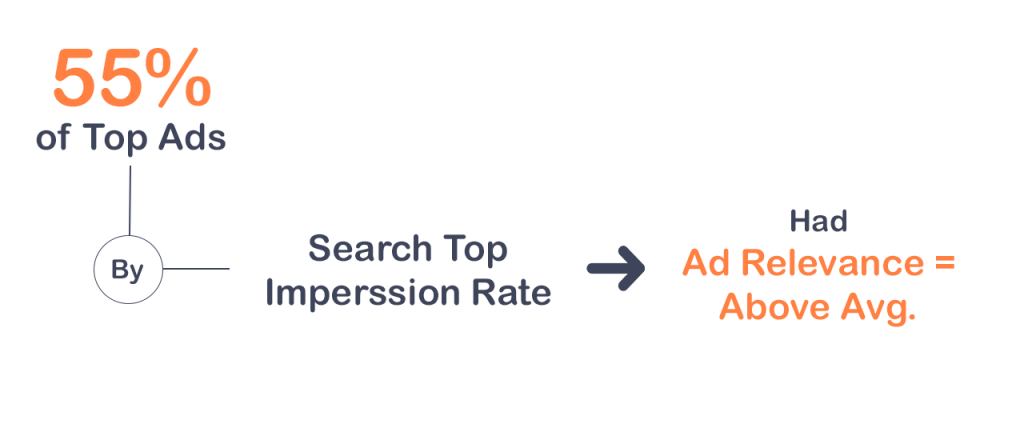
Search Top Impression Rate and Ad Relevance relations
Search Ads Analysis
Quality Score is a metric used by Google to assess ads based on 3 criteria : CTR, Ad Relevance and Landing Page Experience and score ads from 0 (worst quality score) to 10 (best quality score).
Exp. CTR or Expected CTR is Google’s estimation of the rate that ad viewers will click on the ads .
Ad Relevance is How closely your ad matches the intent behind a user’s search.
Search Top Impression Share is the percentage of your ad impressions that are shown anywhere above the organic search results.
We can see the importance of quality score here, 76% of ads having quality score equal to 5 or higher got above average Expt. CTR. It means that those ads got clicked even more than Google’s estimation.
Note that to get a high quality score, the whole process from keyword research, ads title & description, landing page UI & UX and so on, all matters.
Ads with Above average ad relevance got more clicks and 55% of top ads by search top impression rate had above average ads relevance, combining these data we can conclude that if your ads are more relevant they will be shown more often in top section above the organic results and they are more likely to get more clicks.
Research Methodology
Research Main Objective: assessing the performance of search ads campaigns launched in 2021, to gain useful insights to use in future campaigns.
Data Source: The data was downloaded directly from Google Ads Dashboard as a CSV file.
Data analysis tools used in this research: For different steps of research like preprocess and data cleaning, exploratory data analysis (EDA), sorting, grouping and etc., Microsoft Excel and Pandas Library in Python were used.
Data Sampling: I used the Judgmental Sampling method and I downloaded the data of the 4 month of 2021 (last month of each quarter including, March, June, September and December) to have more accurate insights, since each quarter the situation of markets may be different.
Data Cleaning and Analysis: In the report general findings, since the data for “Search Info Section ” has right skewness, Average is not a good indicator for data so I used median instead.